The Mach5+ is a top of the line measurement device with many special features; it can measure 96 individual wells of microplates and will show the following color data for each: L*, a*, B*, X, Y, Z, and %Reflection curve.
Take a look at this 15-second video clip showing the processes in action:
In a little more detail, here are the steps that occur. A user places a microwell plate in the Mach5+. Using standard gridlines, positioning the exact measure locations is automated, helping the user save time. After only 25 seconds, the multi spectral image scan is ready and the color data of the 96 areas is shown. The data is available, and it can easily be copied into Excel or a similar third-party software application for further processing.
View the data in the image below. The background shows the Mach5+ software with the color data. In front, an Excel sheet displays an image of the Microplate and three %Reflection charts. For this demonstration example, we plotted the charts of wells #5, #8 and #12 to demonstrate the color values between 400nm and 700nm. They are shown in 10nm intervals – the settings that color technicians ordinarily use with more traditional spectrophotometers.
If you do a lot of color measurement, you get tired of having to repeat the same steps and repeatable processes over and over again. Color Consult’s Mach5+ will help you end this frustration.
The Mach5+ offers these features to lab technicians and others who need the very best equipment available to automate and simplify the exacting tasks involved in color calibration, and need to do so without sacrificing quality.
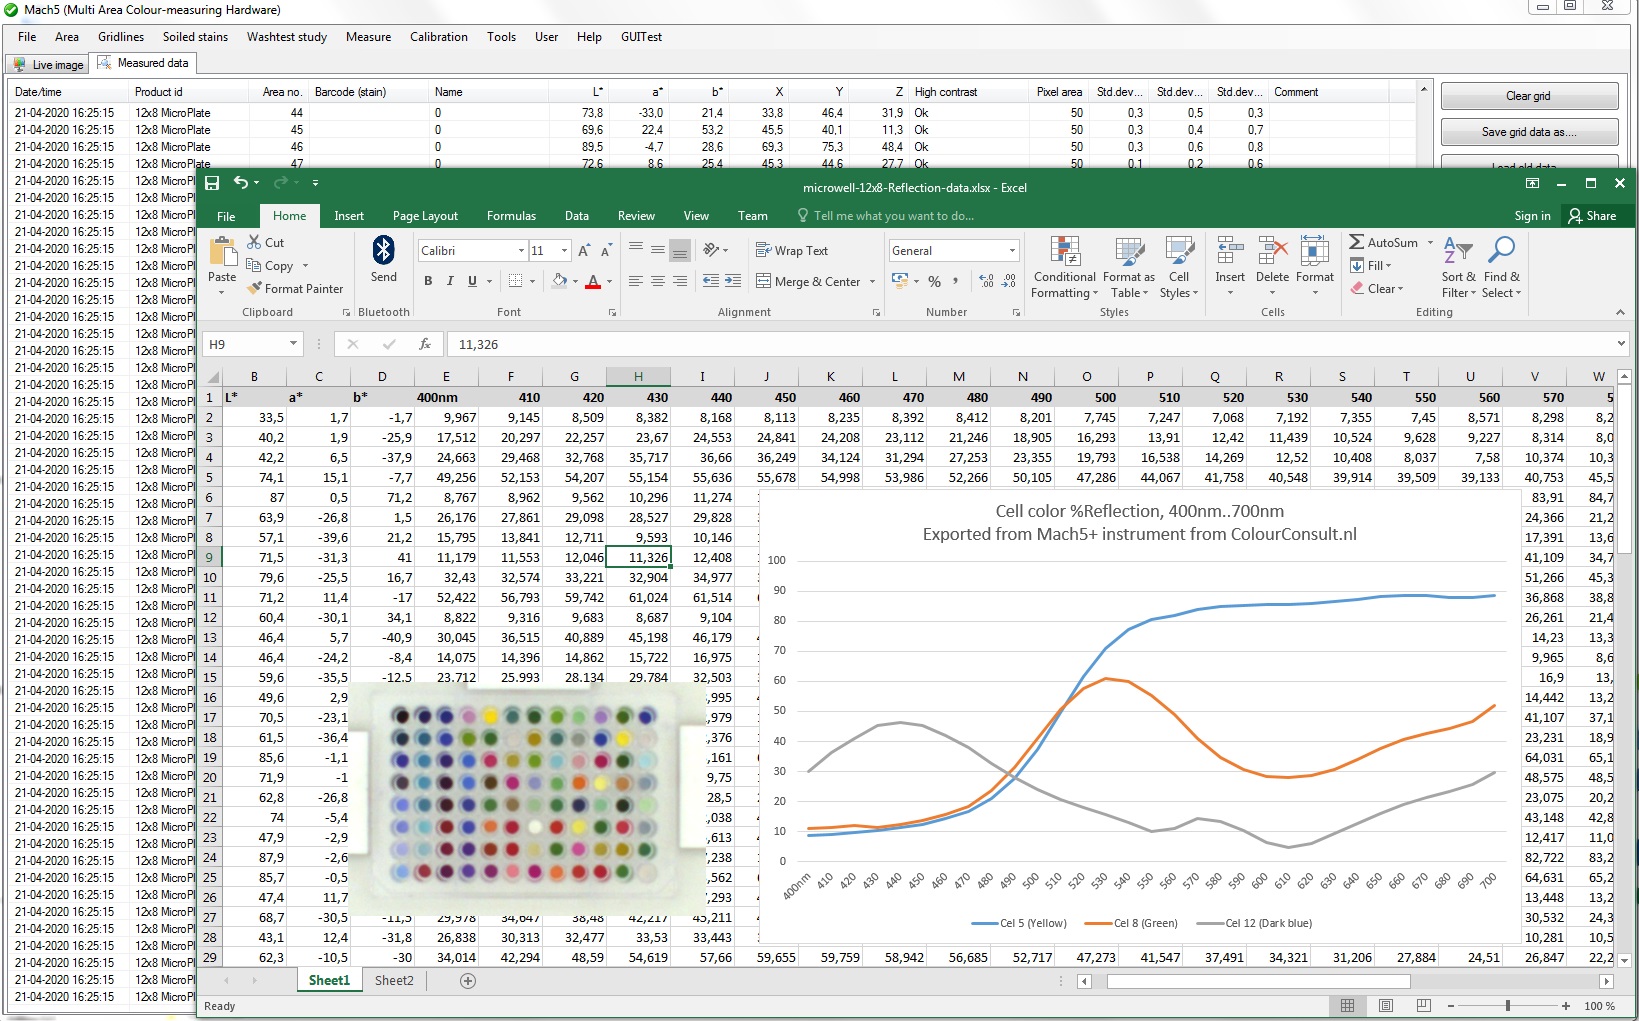
Mach5+ data in Excel, 96 microwell plate measurement
Contact us for more information. At Color Consult, we’re more than happy to answer any questions you have or help you with any specific project you’re involved with..
Contact us or Visit the Mach5+ product page